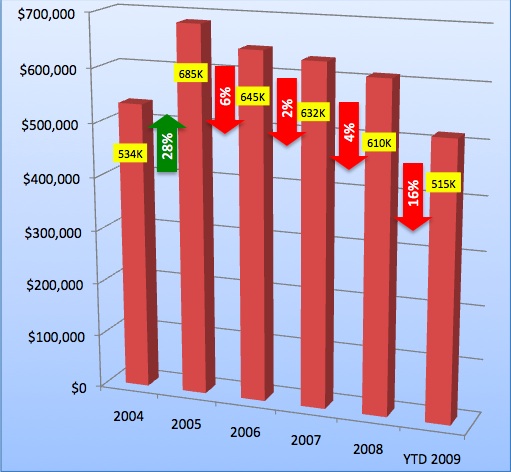
This fancy new graph (I’ve got about 20 hours in to this) is my first effort. It shows median prices in the overall Truckee Real Estate area from 2004 through August 30, 2009. To do the math for you, we are off the 2005 highs at about 28%. This is market wide here in Truckee, and only single family homes. Some neighborhoods have been hit harder.


Leave a Reply